Improving the color match of zirconia crowns

2109 De Cchr P03 610066ead811f


QUESTION:

Most of the zirconia crowns and fixed prostheses coming from my labs lately are too light in color, despite my providing preoperative photos and descriptions to the technicians. I have tried several different laboratories, and I am still frustrated with the mismatched colors. Although zirconia crowns are strong, I believe their color-matching is severely lacking. My colleagues have expressed similar color mismatch as well. What can be done to improve this obvious problem?

ANSWER:

I agree completely with your criticism of the current generation of zirconia crowns. The Technologies in Restoratives and Caries Research (TRAC) Division of the Clinical Research Foundation has accomplished long-term in vivo research on zirconia crowns and found their strength to be fantastic and their service over many years to be outstanding. However, only recently has the color of zirconia crowns been improved so they are more acceptable.

The changes to improve color and translucence of the crowns has been successful, but it also has had some negative effects. The information in Figure 1 is from Glidewell Laboratories and shows remarkable changes over the last several years as ceramic restorations have become mainstream. What are manufacturers doing to improve the esthetics of zirconia restorations? To answer that question, let’s discuss the various types of zirconia.

Zirconia and its various forms

When observing the 2020 data from Glidewell Laboratories in Figure 1, it is obvious that zirconia wins the popularity contest. As you probably know, Glidewell started this clinical revolution with BruxZir, which soon dominated the market. Zirconia-based crowns have been available for more than 21 years, and full-zirconia crowns have been available for about 10 years.

2109 Dec57 60 Chr

In the first few production years, the original zirconia-based crowns had challenges, but since then those problems have largely been overcome. Despite that, the use of zirconia-based restorations has not grown markedly.

Full-zirconia restorations of various formulations are extremely popular and state-of-the-art. But zirconia is not zirconia. You are undoubtedly familiar with the ADA/ISO classification of ceramic crowns, which we previously published in the July 2019 issue of Clinicians Report. (Visit cliniciansreport.orgto read the article in detail.)

The initial BruxZir formulation was classified as class 5 tetragonal zirconia. This is probably what you will receive if you order class 5 or 3Y (3 molar percent yttrium oxide) tetragonal zirconia. This formulation has been used in nondental applications in various industries for more than 30 years. It is the strongest form of zirconia and has optimal transformation toughening (lack of crack propagation) during service. Unfortunately, this is the iteration of dental zirconia most difficult to make esthetically acceptable.

If you are planning a long-span fixed partial denture (FPD) or treating a patient with bruxism, this is an excellent choice shown to be comparable in strength to porcelain-fused-to-metal (PFM) in our long-term TRAC studies. It can be made esthetically acceptable for some situations by presinter staining or optimum use of external stains.

Manufacturers have been experimenting with making 3Y zirconia more esthetic. The most successful and easiest method to date is to increase the translucence by adding more translucent material to the zirconia. ADA/ISO classifies this type of zirconia as class 4 cubic-containing zirconia. It is also identified as 4Y or 5Y or combinations of those percentages. Although additional long-term clinical research is still needed for the so-called esthetic zirconia, class 4 zirconia currently appears to be adequate for singles, short-span FPDs, and other situations not requiring the strength of 3Y zirconia.

Why do you need to know the zirconia classifications?

Your knowledge of these classifications allows you to communicate with salespeople and laboratory technicians, as well as understand what materials you are putting into your patients’ mouths. Knowing this, you’ll better understand the changes that are being made in the original dental zirconia restorations.

Adding more translucent materials to the zirconia. Additional oxides are now being added to the original Glidewell formulation of zirconia (3Y, class 5 zirconia versions) by many manufacturers. This formulation change improves translucency and esthetics. However, the change to 4Y or 5Y or combinations of those reduces the overall strength of zirconia and its ability to “heal” microcracks. (Higher transformation toughening increases the lack of subsequent crack propagation.) Although this procedure reduces strength, clinical success is currently being proven and reported in the field by practicing dentists. The esthetic characteristics of some of these class 4 restorations can rival IPS e.max (Ivoclar Vivadent).

Figure 2: External staining and glazing of zirconia is commonly accomplished in dentistry. Unfortunately, it has some negative characteristics over the long term.

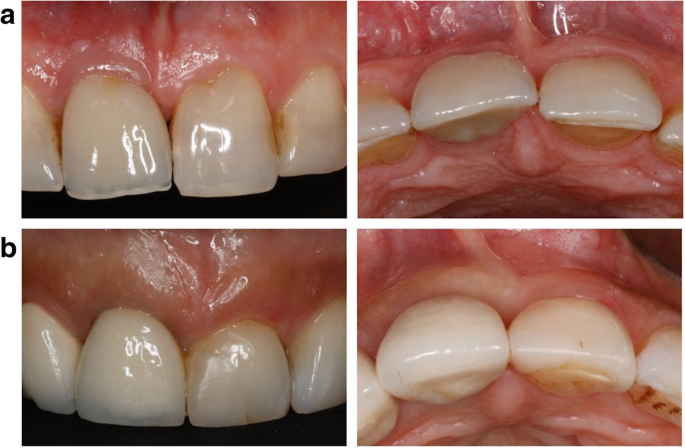
Placing relatively thick layers of stain and glaze on the external of the restorations. Many labs are firing ceramic on the outside of the mismatched zirconia to improve the zirconia color (figure 2). In our research, these additions are usually feldspathic ceramic and are showing wear on the opposing teeth. There is also a slow but continuing loss of the added superficial layers. If the external layers are thin, the result is a slow change back to the original zirconia colors.

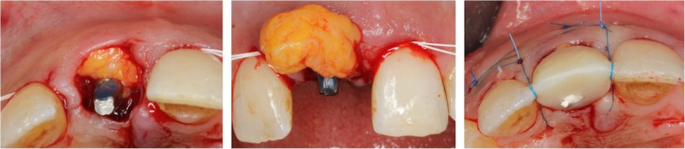
Internal staining of zirconia. Some labs are staining the 3Y, class 5 zirconia in the presintered stage, which improves the color significantly. However, this requires artistic technicians, more time, and a greater cost to the dentist (figure 3).

Figure 3: This rehabilitation, now in service for about five years, has IPS e.max on all teeth except the four molars. The 3Y, class 5 tetragonal full-strength zirconia on the molars was stained in the presintered stage, resulting in esthetics similar to e.max but without external staining.

Currently, most indirect restorations are ceramic, and that trend will undoubtedly continue to grow. Metal and porcelain-to-metal restorations are showing a relatively rapid decrease in use in dentistry.

Is there a dental laboratory problem?

Yes! The laboratory industry has changed rapidly and significantly. Until recently, porcelain-fused-to-metal restorations were the norm. That situation then changed to nearly all ceramic restorations, with zirconia restorations being rapidly produced by milling machines that use computer-driven software and by lithium disilicate being pressed or milled.

Many artistic laboratory technicians are being replaced with highly competent, computer-savvy technicians who produce restorations at record speeds considered to be impossible by older technicians. As a result, restorations are less expensive but often less esthetically acceptable.

If needed, clinicians must seek artistically oriented laboratory technicians to accomplish the complex esthetic results desired for some patients, and consequently, we must expect to pay higher fees for these restorations. Esthetic restorations are available—certainly with lithium disilicate (IPS e.max) and, with effort, even zirconia.

Which indirect restorations are desirable and for what situations?

I have heard some dentists comment with mixed opinions on the esthetic dilemma about which you asked. Most dentists admit, to an embarrassing degree, that many zirconia restorations do not adequately match adjacent teeth, but they further comment that zirconia restorations in the posterior nonesthetic regions are far more esthetically acceptable than gold alloy or porcelain-fused-to-metal when the glaze and staining have worn off.

Porcelain-fused-to-metal

Don’t forget the 70-year success of these restorations, especially when patients have had proven success with previous PFM restorations in their mouths. The advantages and disadvantages of these restorations are well known. Many labs can make highly esthetic PFM restorations. They are especially useful in clinical situations requiring precision or semiprecision attachments, which are not currently available for zirconia or lithium disilicate restorations. An additional continuing use for PFM is long-span fixed prostheses. Although not as commonly used as in the past because of the availability of implants, PFM restorations are still occasionally needed.

Lithium disilicate (most common brand name IPS e.max)

Can you name any other proven successful type of indirect restoration that equals the superior esthetic result of e.max for single-tooth restorations? That question is easy to answer. Many crown types have been tried and were initially successful, but they failed the need for longevity. The success of e.max in selected three-unit anterior FPDs has been shown, but I suggest that the newer generations of zirconia (class 4 zirconia) will probably prove to be more successful for long-term clinical success in these anterior situations.

Summary

The crown revolution has changed almost every treatment plan that requires crowns or fixed prostheses. This article describes the state-of-the-art and makes suggestions about which materials to use, their advantages and limitations, as well as how to produce the esthetic result necessary for specific clinical situations.


Author’s note: The following educational materials from Practical Clinical Courses offer further resources on this topic for you and your staff.

The influence of soft-tissue volume grafting on the maintenance of peri-implant tissue health and stability

Abstract

Background

To investigate the influence of soft-tissue volume grafting employing autogenous connective tissue graft (CTG) simultaneous to implant placement on peri-implant tissue health and stability.

Material and methods

This cross-sectional observational study enrolled 19 patients (n = 29 implants) having dental implants placed with simultaneous soft-tissue volume grafting using CTG (test), and 36 selected controls (n = 55 implants) matched for age and years in function, who underwent conventional implant therapy (i.e., without soft-tissue volume grafting). Clinical outcomes (i.e., plaque index (PI), bleeding on probing (BOP), probing depth (PD), and mucosal recession (MR)) and frequency of peri-implant diseases were evaluated in both groups after a mean follow-up period of 6.15 ± 4.63 years.

Results

Significant differences between test and control groups at the patient level were noted for median BOP (0.0 vs. 25.0%; p = 0.023) and PD scores (2.33 vs. 2.83 mm; p = 0.001), respectively. The prevalence of peri-implant mucositis and peri-implantitis amounted to 42.1% and 5.3% in the test and to 52.8% and 13.9% in the control group, respectively.

Conclusion

Simultaneous soft-tissue grafting using CTG had a beneficial effect on the maintenance of peri-implant health.

Introduction

A major goal of implant therapy is to ensure long-term peri-implant tissue health and create appealing esthetics. To obtain these therapeutic endpoints, soft-tissue grafting procedures performed either simultaneously with or after implant placement have become an indispensable part of contemporary implant dentistry [1].

From a biological point of view, a lack of or reduced height (< 2 mm) of keratinized mucosa (KM) around the implants was shown to jeopardize self-performed oral hygiene measures, which subsequently increased the likelihood of soft-tissue inflammation [12]. As a consequence, soft-tissue grafting procedures aimed at increasing keratinized tissue have been shown to markedly improve peri-implant soft-tissue inflammatory conditions and were associated with higher marginal bone levels compared to the control sites [3]. Moreover, from an esthetic perspective, the presence of KM > 2 mm was demonstrated to be a preventive measure for the occurrence of peri-implant soft-tissue dehiscences [4].

Changes in peri-implant soft-tissue height, particularly on the facial aspect, are a critical factor that may compromise the overall esthetic result of implant-supported restoration [5]. A thin mucosa (also known as a soft-tissue biotype) at the time of implant installation was found to be a crucial component that correlated with facial soft-tissue recession [6,7,8]. In fact, to attenuate the undesirable changes of the soft-tissue margin, soft-tissue volume augmentation at the time of implant placement was also suggested as a preventive measure [910]. On the contrary, currently available data evaluating procedures to increase mucosal thickness did not show any significant effects on bleeding scores, but higher interproximal marginal bone levels over time when compared with control sites [1]. Due to a lack of reporting, an evaluation of the prevalence of peri-implant disease was not feasible [1].

Therefore, the aim of the present cross-sectional analysis was to assess the influence of soft tissue volume grafting on the peri-implant tissue health and stability.

Materials and methods

The present investigation was designed as an observational, cross-sectional case–control study evaluating the clinical treatment outcomes of implants inserted simultaneously with (test group) and without (control group) soft-tissue volume augmentation. All patients had received the same implant brand (Ankylos®, Dentsply Sirona Implants, Hanau, Germany) in a single university clinic (Department of Oral Surgery and Implantology, Goethe University, Frankfurt) and were recruited during their yearly maintenance visits.

Patients were included in the study once they were informed about the investigation procedures and gave their written informed consent. The procedures in the present study were in accordance with the Declaration of Helsinki, as revised in 2013, and the study protocol was approved by the local ethics committee (registration number: 78/18).

Patient selection criteria

The following inclusion criteria were applied for patient selection:

– Patients with > 18 years of age rehabilitated with at least one Ankylos® implant;

– Patients with treated chronic periodontitis and proper periodontal maintenance care;

– Non-smokers, smokers and former smokers;

– A good level of oral hygiene as evidenced by a plaque index (PI) < 1 at the implant level; and

– Attendance of yearly routine implant maintenance appointment.

Patients were excluded for the following conditions: the presence of combined endodontic–periodontal lesions; systemic diseases that could influence the outcome of the therapy, such as diabetes (HbA1c > 7), osteoporosis and antiresorptive therapy; a history of malignancy, radiotherapy, chemotherapy, or immunodeficiency; and pregnancy or lactation at the last follow-up.

Surgical protocol

Soft-tissue biotype was assessed preoperatively based on the probe’s transparency at the mid-facial aspect and categorized as thin when the probe was visible and thin when it was not visible. Two-piece platform-switched implants were placed 2–3 mm subcrestally according to the manufacturer’s surgical protocol. Implants in the control group exhibited a thick soft-tissue biotype and therefore underwent a conventional placement protocol (i.e., without soft-tissue volume grafting; Fig. 1a).

figure1
Fig. 1

Implants in the test group presented with a thin soft-tissue biotype, and therefore, a connective tissue graft (CTG) harvested from the hard palate was simultaneously applied on the facial aspect via tunneling technique (Fig. 1b and Fig. 2). All surgeries were performed by one experienced oral surgeon (PP).

figure2
Fig. 2

Implant and implant-site characteristics

The following study variables were assessed for the test and control implant sites: (1) implant age (i.e., defined as time after implant placement), (2) implant location in the upper jaw, and (3) implant diameter.

Clinical measurements

The following clinical parameters were registered at each implant site using a periodontal probe: (1) plaque index (PI) (Löe et al., 1967); (2) bleeding on probing (BOP)—measured as presence/absence; (3) probing depth (PD)—measured from the mucosal margin to the probable pocket; (4) mucosal recession (MR)—measured from the restoration margin to the mucosal margin; and (5) keratinized mucosa (KM) (mm)—measured on the buccal aspects of the implants.

PI, BOP, PD, and MR measurements were performed at six aspects per implant site: mesiobuccal (mb), midbuccal (b), distobuccal (db), mesiooral (mo), midoral (o), and distooral (do). KM measurement was performed at three aspects per implant site: mesiobuccal (mb), midbuccal (b), and distobuccal (db).

The presence of peri-implant diseases at each implant site was assessed as follows [11]:

  • Peri-implant mucositis defined as the presence of BOP and/or suppuration with on gentle probing with or without increased PDs compared to previous examinations and an absence of bone loss beyond crestal bone level changes resulting from initial bone remodeling.
  • Peri-implantitis defined as the presence of BOP and/or suppuration on gentle probing, increased PDs compared to previous examination, and the presence of bone loss beyond crestal bone level changes resulting from initial bone remodeling.

Radiographs (i.e., panoramic) were just taken when clinical signs suggested the presence of peri-implant tissue inflammation (i.e., the presence of BOP). To estimate the bone level changes at the respective implant sites, these radiographs were compared with those taken following the placement of the final prosthetic reconstruction (i.e., baseline).

Investigators meeting and calibration

Prior to the start of the study, a calibration meeting was held with each examiner (KO, AB, AR) to standardize (pseudonymous) data acquisition and the assessment of study variables. For the calibration of the examiners, double measurements were performed with a 5-min interval of the assessed clinical parameters in 5 patients with a total of 15 implants. The calibration was acceptable when repeated measurements were similar > 95% level. The documentation of demographic study variables, implant sites’ characteristics, and clinical measurements were documented using a generated standardized data extraction template.

Statistical analysis

The statistical analysis was performed using a commercially available software program (SPSS Statistics 27.0: IBM Corp., Ehningen, Germany). Descriptive statistics (means, standard deviations, medians and 95% confidence intervals) were calculated for mPI, BOP, PD, and MR values. The analysis was performed at the patient and implant levels. The data were tested for normality by means of the Shapiro-Wilk test. Comparisons of clinical parameters between the test and control groups were performed by employing the Mann-Whitney U test. Linear regression analyses were used to depict the relationship between mean BOP, PD, and MR values and KM scores. The alpha error was set at 0.05.

Results

Patient and implant sites’ characteristics

The test group included 19 patients (13 women and 6 men) with a total of 29 implants, whereas the control group included 36 patients (20 women and 16 men) with a total of 55 implants. Mean patient age in the test and control groups was 46.24 ± 18.48 and 62.21 ± 14.41 years, respectively. The mean implant functioning time was 4.16 ± 2.06 years for the test group and 7.19 ± 5.25 years for the control group. All implants in the test group revealed a diameter of 3.5 mm with an equal distribution between all regions investigated. In the control group, the most frequent diameter was also 3.5 mm (85.5%), with a predominant implant location in the region of the lateral and central incisors (Table 1).Table 1 Patient and implant site characteristicsFull size table

Clinical measurements

The results of the clinical measurements are presented in Table 2. In general, test and control groups were commonly characterized by low median PI scores at both patient (0.00 vs. 0.21; p = 0.093) and implant levels (0.17 vs. 0.17), respectively.Table 2 Clinical parameters (mean ± SD, median and 95% CI)Full size table

Marked differences between test and control groups were noted for median BOP scores, reaching statistical significance at the patient level (0.0 vs. 25.0%; p = 0.023).

Similarly, the test group was associated with markedly lower median PD values at both patient (2.33 vs. 2.83 mm; p = 0.001) and implant levels (2.33 vs. 2.83 mm), respectively.

Both groups revealed comparable median MR values at both patient (0.0 vs. 0.0 mm; p = 0.76) and implant levels (0.0 vs. 0.0 mm), respectively (Table 2).

Prevalence of peri-implant diseases

The frequency distribution of peri-implant diseases in the test and control groups at patient and implant levels is summarized in Tables 3 and 4.Table 3 Prevalence of peri-implant disease (patient level)Full size tableTable 4 Prevalence of peri-implant disease (implant level)Full size table

According to the given case definitions, 66.7% of the patients in the control group and 47.4% of the patients in the test group were diagnosed with peri-implant diseases. In the test group, the prevalence of peri-implant mucositis and peri-implantitis amounted to 42.1% and 5.3%. In the control group, the corresponding values were 52.8% and 13.9%, respectively (Table 3).

At the implant level, the prevalence of peri-implant mucositis and peri-implantitis amounted to 44.8% and 3.4% in the test group, and 52.7 and 9.1% in the control group, respectively (Table 4).

Regression analysis

Cross-tables depicting selected independent variables (PD, MR, and BOP values) and local factors (i.e., KM and Implant age) in both test and control groups are summarized in Tables 5and 6.Table 5 Test group (n = 29 implants). Cross-tables of BOP/PD/MR values and (1) KM and (2) implant age (months)Full size tableTable 6 Control group (n = 55 implants). Cross-tables of BOP/PD/MR values and (1) KM and (2) implant age (months)Full size table

In the test group, the linear regression analysis failed to reveal any significant correlations between KM and the independent variables investigated.

In the control group, a significant correlation was noted between KM and MR values (R2 = 0.155; B = − 0.072; p = 0.003) (Tables 5 and 6).

Discussion

The present cross-sectional analysis aimed at investigating the influence of soft-tissue volume grafting employing autogenous CTG simultaneous to implant placement on peri-implant tissue health and stability. Based on the clinical parameters investigated, it was noted that the patients in the test group revealed significantly lower BOP and PD scores when compared with those of the control group. This was associated with a lower prevalence of peri-implant diseases, particularly of patients diagnosed for peri-implantitis. In this context, it must be emphasized that the latter assessment was based on recently established case definitions and considered previous examination data [11].

Basically, the present results do not confirm the findings of a recent systematic review and meta-analysis, since soft tissue grafting procedures by means of CTG were not associated with any significant differences in BOP or PD values as compared to control treatments [1]. The analysis was based on a total of 6 randomized (n = 2)/controlled clinical (n = 4) studies reporting on a total of 260 systemically and periodontally healthy patients over a mean follow-up period of 57 months [912,13,14,15,16]. Except for one study [17], the implants were placed immediately and soft tissue grafting was accomplished either at implant placement [91215], or after a healing period of 3 months [131416]. At test sites, the range of mean BOP values was 20–35% at baseline and amounted to 20–56% at follow-up [14,15,16,17]. The corresponding values at control sites were 21–40% at baseline and 33–46% at follow-up [1]. A total of five studies [913,14,15,16] failed to identify any significant effects of soft-tissue volume grafting on mean PD values. In particular, at test sites, the range of mean PD values was 2.50–3.45 mm at baseline and amounted to 3.67–4.09 mm at follow-up. At control sites, these values were 2.50–3.20 mm at baseline and 3.20–3.97 mm at follow-up [1]. One study focusing on immediate implant placement with simultaneous soft-tissue volume grafting reported on significantly lower PD values at test sites when compared with control sites [12].

The meta-analysis failed to reveal any significant differences in either plaque, BOP, or PD scores (i.e., changes or endpoint values) between test and control groups. However, significantly less marginal bone loss over time was observed with the use of CTG [n = 2; WMD = 0.110; 95% CI (0.067; 0.154); p < 0.001] when compared to sites without grafting [1].

The discrepancy noted between the present analysis and the aforementioned systematic review may, at least in part, be explained by the fact that the included studies [912,13,14,15,16] did not consider BOP or PD as primary outcomes measures. Accordingly, the power of these studies may not have been sufficient to rule out potential differences between groups. Moreover, it needs to be emphasized that none of the evaluated studies [912,13,14,15,16] used case definitions for the evaluation of the occurrence of peri-implant diseases [1].

The present study did not consider to routinely take radiographs during follow-up, but just limited the indication to those patients exhibiting clinical signs of peri-implant tissue inflammation [18]. Accordingly, the influence of soft-tissue volume grafting procedures on marginal bone level changes could not be assessed.

When further evaluating the present data, it was also noted that, in contrast to implants of the test group, control sites revealed a significant correlation between KM and MR values. In this context, it must be emphasized that a major drawback of the present study was the lack of a quantification of the horizontal mucosal thickness (i.e., biotype) during follow-up. That was due to the fact that the assessment of the biotype is challenging at diseased implant sites, since the inflammatory lesion is inevitably associated with an increase in mucosal thickness [19]. As a consequence of the notable prevalence of peri-implant diseases in both groups, it may have been impossible to estimate true changes of the biotype during follow-up.

Nevertheless, the findings of the regression analysis corroborate the results of previous studies also indicating that at implant sites exhibiting a healthy peri-implant mucosa, a thick tissue biotype was associated with a lower frequency of facial soft-tissue recessions (i.e., MR values) over time when compared with sites exhibiting a thin biotype [620].

In conclusion and within its limitations, the present study has indicated that simultaneous soft-tissue grafting using CTG had a beneficial effect on the maintenance of peri-implant health.

Obreja, K., Ramanauskaite, A., Begic, A. et al. The influence of soft-tissue volume grafting on the maintenance of peri-implant tissue health and stability. Int J Implant Dent7, 15 (2021). https://doi.org/10.1186/s40729-021-00295-1

Zircon Lab is America’s leading dental lab. We are partnered with dental offices nationwide and are consistently growing. As America’s highest quality dental lab with the most competitive pricing, the highest caliber of product, expert craftsmanship, and fastest delivery, we set the dental industry standard. After choosing Zircon Lab to be your dental lab of choice, you can trust our dental product will be unmatched by any competitors.

Zircon Lab with Border_White

Choose The Right Dental Lab, The First Time

    Zircon Lab, LLC specializes in high end Zirconia (Bruxer), Aesthetic High Translucent Full Zirconia Crowns for Anteriors, e.max, and implants. All of our restorations are 100% made in the USA and we are the only dental lab to have an unconditional, 100% lifetime warranty.

Contact Info

8060 Reeder St. | Overland Park, KS 66214

+1 888.880.3383
contact@zirconlab.com

Monday - Friday: 8:00 am - 5:00 pm CST
Saturday & Sunday: Closed

Copyright 2023 Zircon Lab, LLC ©  All Rights Reserved